Debian 12 running slower than CentOS 7
Version $Id: debian-slow.html,v 1.8 2024/10/25 08:05:37 madhatta Exp $
teaparty.net lives
in a colo, which becomes a fairly expensive undertaking if you need more
than in 1U of rack space,
or you draw more than half an amp (which in the UK means 120W total
power consumption). So it runs on fairly minimalist hardware: a miniITX
motherboard and a low-power CPU, to keep the current draw down, and a couple of
bog-standard SATA drives for storage to keep the chassis size down.
Given the duty cycle on teaparty,
this worked perfectly fine under CentOS 7, but C7 came to end-of-life on 30/6/24,
and Red Hat (under the control of IBM) was playing silly buggers with CentOS
Stream. I'd decided the year before that I was going to migrate everything I
controlled to Debian, and had done so. teaparty was the last system to go.
As you can see from teaparty's (externally-hosted) system status page, I downed, backed up,
reinstalled, and restored the system on 11-12/3/24. As soon as the system came
back into service, it was clear that we had a bad performance problem. Opening
an IMAP folder took five to fifteen seconds, and
interactive response in the shell
often lagged by half a second or so. I started to try to get a handle on the
problem.
Parametrising the problem
This is a graph of system load over the past year. I've added a couple of
coloured bars at the top to aid with interpretation. The blue bar is
pre-upgrade, CentOS 7 operation; the red bar is post-ugprade, Debian 12
operation before I got a handle on the problem; and the final
section, without a bar, is our current, usable, Debian 12 period of operation.
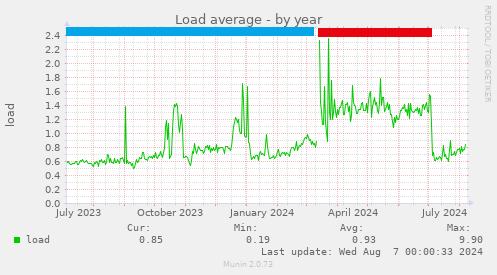 You can see that it was fairly stable around 0.6 until the upgrade in March 2024,
then it stayed fairly fixed around 1.3 until I got a handle on the problem in
early July, at which point it reverted to pretty much pre-upgrade levels. More
insight comes from the annual CPU usage graph:
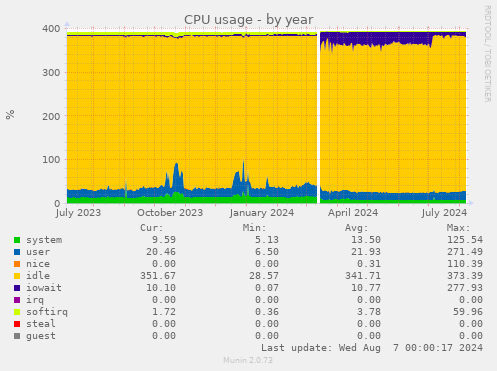 The period of raised load corresponds with a period of increased iowait for the
CPUs; normal background of 10% went up to around 30% the entire time, and if you
read the legend, it maxed out at 278%. That's a lot of iowait. It's also worth
noting that there's no corresponding increase in user CPU, and that there's lots
of idle CPU throughout. Here are the latency graphs for the metadevice with the root
partition on it:
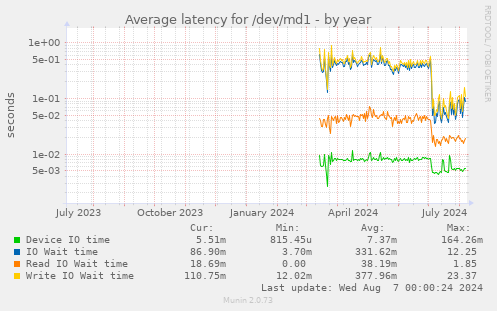 It's annoying that the name of the root metadevice changed as part of the
installation, so you can't see the "before" stats; but the improvement in July is
very noticeable (note that this is a log-lin graph, so the fall in July is
extremely significant; write latencies have fallen by nearly a factor of
ten). Note also the actual level of average write IO
wait time during the problem period: 0.3 to 0.4s, with a maximum (from the legend) of
23.3s; that is a dreadful wait
time for a root partition; no UNIX system will run well under these
circumstances.
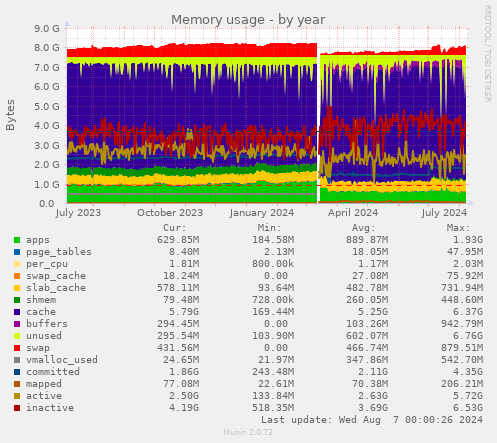
Finally, here's a graph of memory usage. If anything, since the upgrade swap
usage has decreased slightly (it was never high), "committed" memory has
fallen, there's lots of memory available for file system cacheing both before and
after, and inactive memory averages 3.6GB and has never fallen below 518MB.

At this point, it seemed to me that the evidence pointed to an IO bottleneck, and
only that; the system had no CPU or memory pressure.
Identifying the problem
My first hypothesis was that it was simply slower to write to the discs under D12
than it had been under C7. After all, we'd jumped from a 3.10 kernel to a 6.1 kernel;
that's about ten years of development in a single bound, and all the system tools,
utilities, and the like, jumped a similar period with it. Software generally
gets bigger over time; its requirements and footprints increase, and maybe the
hardware that was adequate for my duty cycle under 2014 tools wasn't adequate for
one under 2024 tools.
My problem was that that was a diagnosis of exclusion, and left me
nowhere to go; all I could do was shotgun the entire system and get
brand-new hardware, with much chunkier discs,
and see
if that made the problem go away.
However, in addition to
being quite expensive this would also have increased my colo bill,
so I tried some other, more-specific
hypotheses first. I wondered if the problem was that the system was
installed BIOS-booting; the BIOS code, I presumed, is old and sad,
and nobody's working on it much any more. So I reinstalled the system
under UEFI booting (it's quite hard to simply migrate from one to the
other when you're also mirroring everything). That reinstall was done on
22/3, and as you can probably see, that didn't help; it corresponds with
the second large spike in system load, because load was always
much elevated during the two days it took to sync up the root RAID.
After the resync spike, we returned to post-Debian-install levels.
Since I was fairly convinced the problem was IO-bound, and because
I've been bitten by this before, I'd checked that my rsyslog
wasn't doing a lot of file-sync-after-each-write (which is prevented by
prefixing each file name in /etc/rsyslog.conf with a -).
I wondered if the problem was that my motherboard had 3Gbps SATA channels.
A friendly client gave me an old firewall chassis that had a similar
motherboard, but with 6Gbps SATA, and I was getting ready to swap that
in when I got lucky.
I had been wondering what exactly was doing all this IO. I found the
tool iotop,
which allows me to examine the realtime IO demand of processes in
much the same way as top allows me to do it for CPU demand.
iotop's in the Debian repositories (yaay Debian devs!) so installing
it was easy. But running it in real-time mode (iotop -d 3)
wasn't particularly edifying. I could sort of convince myself that
systemd-journald cropped up a little more than anything else, but
it was hardly definitive evidence. However, it gave me a new hypothesis.
Some diligent web searching led me to this ticket
in the systemd github. That in turn pointed me towards iotop in
accumulated-count mode (iotop -ao). I left this running for
a few hours, and found that systemd-journald had accumulated about 90%
of the total writes made on the system in that time. This involved
nearly a gigabyte of writes to a single file, which if memory serves was
/var/log/journal/LONG-HEX-NUMBER/system.journal, a file
that itself was only about 30MB long. Clearly, this file was being used
as some sort of scratchpad/ring-buffer-type storage. Reading the man
pages revealed that the configuration option Storage=auto in
/etc/systemd/journald.conf instructed systemd-journald to write
to disc if the directory /var/log/journal existed, which it did;
changing that variable to Storage=volatile caused it to write
to memory, which I have aplenty, via the /run tmpfs file system.
I note some fairly acerbic comments in the intial exchange on that github
ticket, both from Lennart Poettering, and his acolytes, who
seem contemptuous of the use of iotop, and all other techniques
used by the reporter, to measure the write-load of systemd. However,
they fail to suggest how it should be measured instead; at one point
a particularly pissy team member goes so far as to forbid the reporter
from asking how to report the information they want as part of the bug
reporting process. Poettering does suggest a config change before noting
that it, too, won't produce useful information, but on the whole I get a
pretty hostile vibe from the systemd team in the early comment exchange.
The thumb icons may give some idea how the larger world feels about this.
All I can say is that I changed to using volatile storage for
systemd-journald at 1025BST on 3/7/2024, and as I think the graphs show
pretty tidily, the problem immediately disappeared. I'm sorry
I no longer have the five-minute graph covering that period, but please
believe me when I say the improvement was instantaneous. So I can say
with some certainty that, at least under some circumstances, iotop is
a very good tool for diagnosing whether or not systemd is giving you a
write bottleneck.
Back to Technotes index
Back to main page
 You can see that it was fairly stable around 0.6 until the upgrade in March 2024,
then it stayed fairly fixed around 1.3 until I got a handle on the problem in
early July, at which point it reverted to pretty much pre-upgrade levels. More
insight comes from the annual CPU usage graph:
 The period of raised load corresponds with a period of increased iowait for the
CPUs; normal background of 10% went up to around 30% the entire time, and if you
read the legend, it maxed out at 278%. That's a lot of iowait. It's also worth
noting that there's no corresponding increase in user CPU, and that there's lots
of idle CPU throughout. Here are the latency graphs for the metadevice with the root
partition on it:
 It's annoying that the name of the root metadevice changed as part of the
installation, so you can't see the "before" stats; but the improvement in July is
very noticeable (note that this is a log-lin graph, so the fall in July is
extremely significant; write latencies have fallen by nearly a factor of
ten). Note also the actual level of average write IO
wait time during the problem period: 0.3 to 0.4s, with a maximum (from the legend) of
23.3s; that is a dreadful wait
time for a root partition; no UNIX system will run well under these
circumstances.
